TL;DR
This is Part 1 of a two-part documentary essay on the Port of San Francisco. Part 1 maps what the Port is, what it earns money doing, what has happened to its industrial portfolio, and the capital backlog the next Commission will inherit. Part 2 documents the institutional record. It covers the geographic concentration, the 35-year thread on Proposition H, the Commission’s operating pattern, and the Summer 2026 decision window. Three findings in this part.
- Revenue mix. The Port’s operating revenue is 79% non-maritime and 18% maritime, a thirteen-year compounding pattern driven by development ground leases on former-industrial parcels at Pier 70 and Mission Rock.
- Industrial portfolio shrinkage. Reported industrial-portfolio acreage declined 43% between FY 2015 and FY 2022 (9.8M to 5.6M sq ft); revenue per square foot rose 134%. The larger portion of the decline is a September 2019 accounting reclassification, not real loss of industrial tenancy. Part 2 covers how this remaining industrial-zoned acreage sits geographically, how the City’s own 2002 and 2008 record treats it as complementary rather than competing with housing, and how Bayview-Hunters Point is most directly affected by what comes next.
- Capital backlog. The April 2025 10-Year Capital Plan documents $6.1B in capital need against $2.6B unfunded. The Five-Year CIP funds approximately 16% of identified state-of-good-repair need.
This essay does not argue what should be. It assembles what is.
The Land
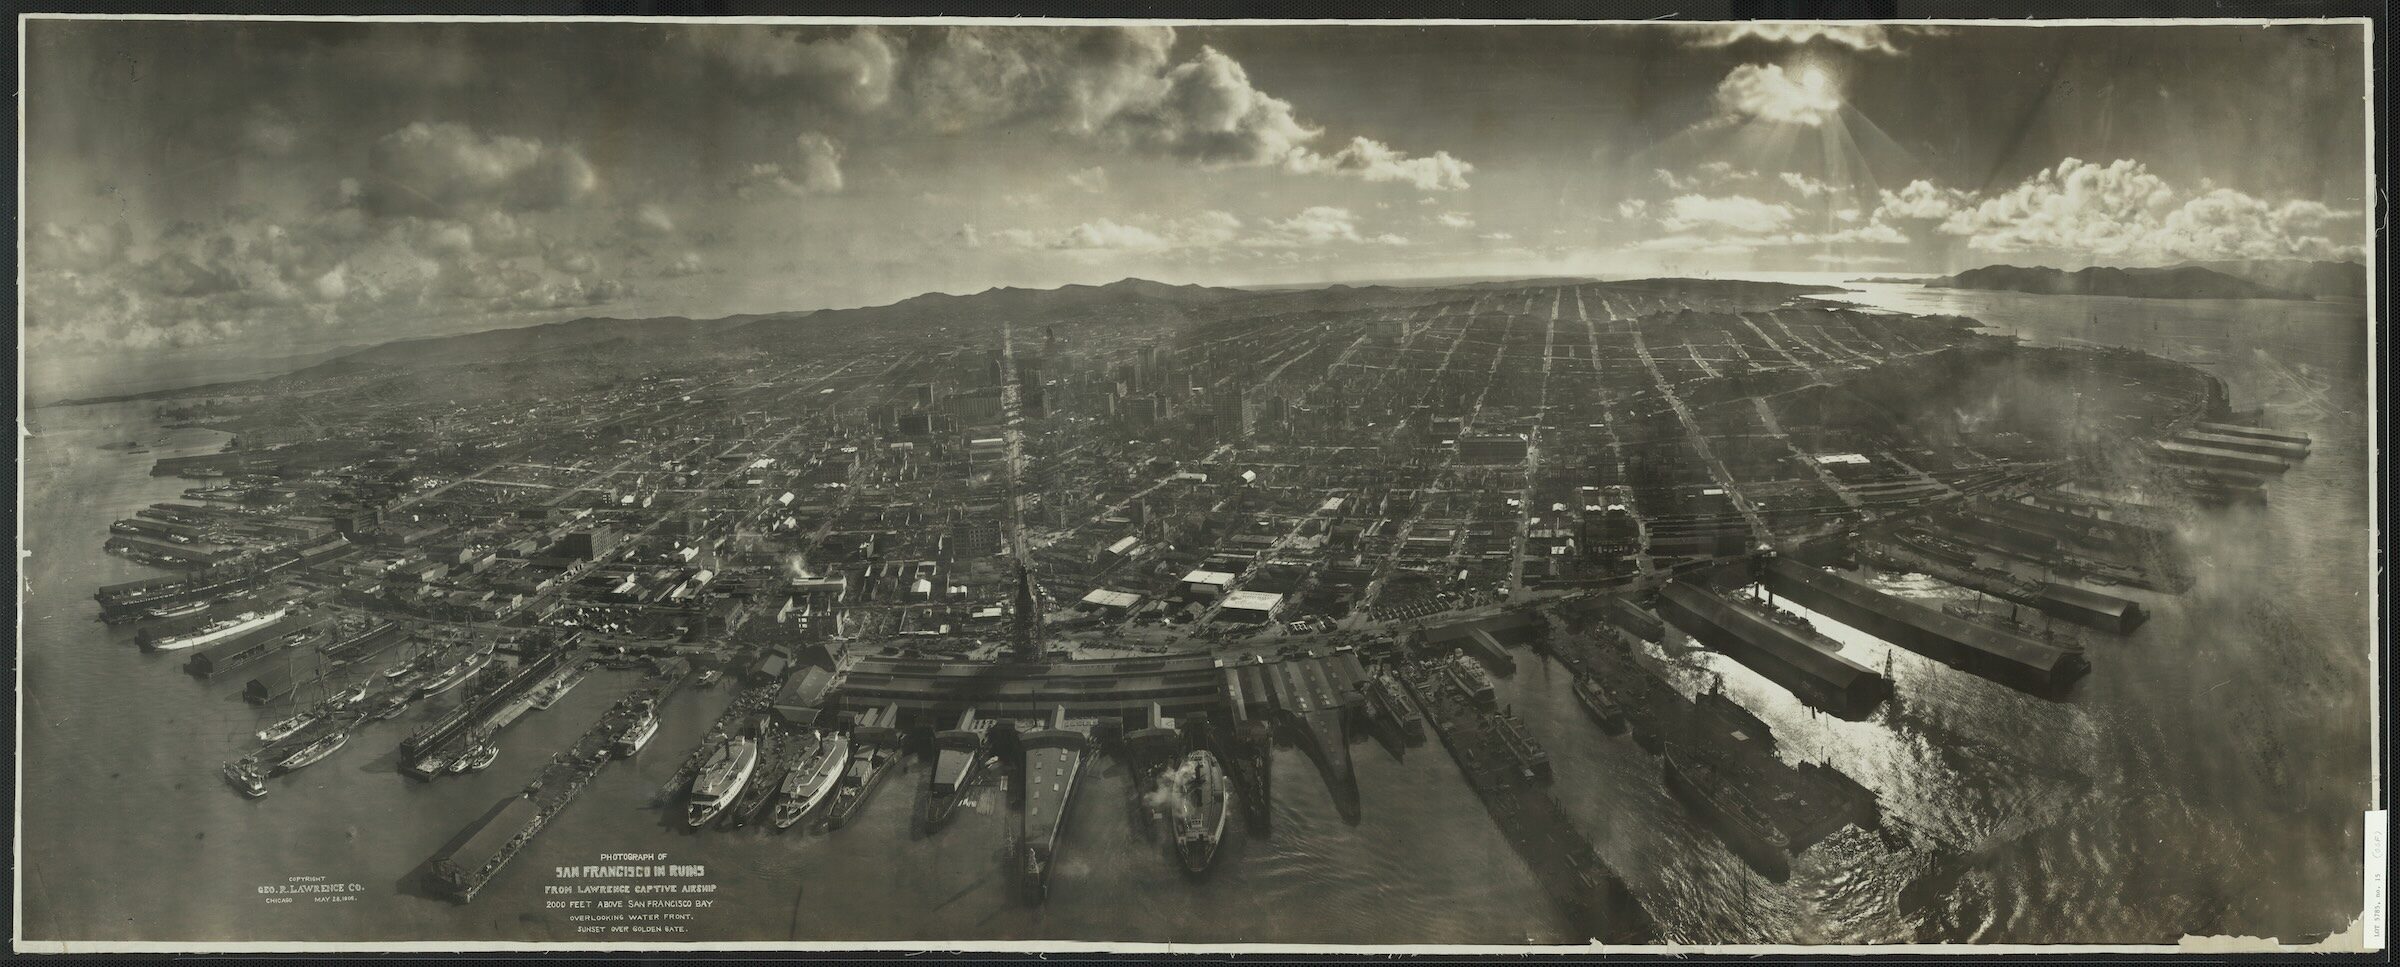
The Port of San Francisco controls 600 upland acres along seven and a half miles of waterfront, from Hyde Street Pier at Aquatic Park to India Basin in the south (Figure 1). The portfolio consists of 39 piers, 43 inland seawall lots, and 245 commercial and industrial buildings: roughly 20 million square feet of building space. It is the largest single property holding controlled by the City and County of San Francisco — held in trust, not owned outright.
What the working portion of that portfolio supplies is not abstract. Pier 92, on the Southern Waterfront, hosts the city’s only two concrete batch plants: every cubic yard of concrete poured anywhere in San Francisco comes from those two plants, a constraint imposed by concrete’s 90-minute hot-load delivery limit. Fisherman’s Wharf hosts the only remaining commercial fishing fleet on the city waterfront. Pier 80 is the only roll-on/roll-off and project-cargo terminal within San Francisco city limits. These are working-waterfront capacities that are invisible until they are lost.

The portfolio divides geographically into three zones. The Northern Waterfront runs from Aquatic Park through Fisherman’s Wharf and the Pier 27 Cruise Terminal, then south past the Ferry Building and the Embarcadero piers to roughly Folsom Street; this is the waterfront most San Franciscans and most visitors experience. The Mission Bay and Central Waterfront zone runs from Folsom south through Pier 70, the Mission Rock development site, and the China Basin entitled-development corridor. The Southern Waterfront covers Pier 80, the Pier 90 through 94 complex, Pier 96, and Heron’s Head Park, ending at the federal Hunters Point Naval Shipyard boundary; it contains roughly 80% of the Port’s currently industrial-zoned acreage and sits in or directly adjacent to District 10 in Bayview-Hunters Point.
The three zones share one institution, one legal framework, and one Commission. What this piece records is, in important respects, how the Port’s northern and southern coastlines came to operate differently inside that single institution. The Port’s industrial-zoned land is one of two industrial-land regimes in San Francisco; the other, addressed below, is SF Planning’s Production, Distribution, and Repair (PDR) districts.
The Port is an enterprise agency of the City and County of San Francisco. It receives no General Fund support. It funds itself through lease revenue, parking, harbor fees, and federal grants.
The legal cage

The Port operates inside an unusually layered legal framework. The standard hierarchy of American law produces three levels of government, each generating four types of law: constitutional, statutory, administrative, and case. Most City departments operate primarily in the local-statutory and local-administrative cells. The Port operates under all twelve (Figure 2).
The state-statutory layer is the densest. The Burton Act of 1968 transferred tideland property from the State of California to the City for public trust management. The McAteer-Petris Act established the Bay Conservation and Development Commission. SB 1085 (2005) authorized Infrastructure Financing Districts on Port property. The 1971 California Supreme Court decision in Marks v. Whitney expanded permitted public-trust uses beyond commerce, navigation, and fisheries to include environmental and recreational purposes. The U.S. Supreme Court's 1892 decision in Illinois Central Railroad v. Illinois anchors the federal-case layer as the foundational precedent for the public trust doctrine over submerged lands.
The local-constitutional cell is empty because the City and County of San Francisco is not sovereign. Local statutory law operates through SF Charter Section 4.114 (establishing the Port Commission) and Section B3.581 (incorporating the Burton Act by reference). The single most consequential piece of local statutory law for the Port is Proposition H of 1990. Local administrative law operates through Port Commission resolutions, the Waterfront Land Use Plan, and the Port Building Code, which the Port enforces itself separately from the SF Building Code.
Maritime commerce, navigation, fisheries, water-dependent activities, and statewide public benefit are the legally permitted uses. Non-trust uses such as housing, office, and hospitality require site-specific California legislation that releases the parcel from trust restrictions before the Port can lease it for those uses. For Port-controlled tidelands, the two working precedents are Pier 70 and Mission Rock, both in the Central Waterfront.
A second industrial-land regime, off-Port
San Francisco’s industrial-zoned land is governed by two separate regimes. The Port’s industrial-zoned acreage operates under the apparatus described above. The city’s other industrial-zoned land, off-Port, operates under SF Planning’s Production, Distribution, and Repair (PDR) districts, codified in Planning Code Section 210.3 and established through the Eastern Neighborhoods rezoning adopted by the Board of Supervisors in December 2008. The two regimes share a geography, particularly in the Central Waterfront where Port-controlled parcels at Pier 70 and Mission Rock sit adjacent to PDR-zoned Dogpatch and Showplace Square parcels under SF Planning jurisdiction. This essay covers the Port regime. The PDR regime is referenced where it bears on the Port’s geography. The privately-operated American Industrial Center, addressed in Section 3b as a comparison case, operates on PDR-2 zoned land.
Proposition H, 1990
The most consequential piece of local statutory law for the Port is a 1990 ballot initiative against pier-based hotel development. Proposition H was placed on the November 1990 ballot by citizen petition, organizing against a Port-approved program of pier hotels. The initiative did two things. It prohibited new hotels within 100 feet of the shoreline on Port property, a setback that effectively banned hotels on the piers themselves. And it required the Port to adopt a comprehensive Waterfront Land Use Plan before any further non-maritime commercial development could proceed.
The Port's Executive Director publicly opposed the ban, arguing it would jeopardize a $100 million Port overhaul aimed at competing with the Port of Oakland. Proposition H passed anyway. Because Prop H was voter-enacted, it can only be modified or repealed by another vote of the people. The Plan itself can be updated by the Port Commission. The underlying setback cannot. After passage, the Executive Director said:
“If you’re developing waterfronts, you have to be very patient... The port has to look very seriously at writing that (two-hotel) limitation into law.”
The Port executive’s posture from the moment the ban became law was one of careful interest in future revisitation, re-engaged at roughly decade intervals, quietly in 2017 and explicitly in 2026. The 1990 capital pressure of $100 million has grown to a documented $2.6 billion unfunded backlog by 2026 (Section 5). It is a 35-year thread, not a 2026 development.
What the Port Earns Money Doing
The Port reports total operating revenue of approximately $128 million for the most recent fiscal year. Of that, 79% came from non-maritime sources, and 18% came from maritime sources (Figure 3). The remaining 3% is parking and harbor service fees.
The table below positions San Francisco against other major American port authorities by reported operating revenue. San Francisco is a small port by revenue compared to its peer institutions. It sits in the same governance category as Oakland, Seattle, Long Beach, and Los Angeles. Each is a self-supporting enterprise department of its host city, with a public-trust mandate over its tidelands, accountable to a publicly-appointed Commission.
| Port authority | Operating revenue | Fiscal year | Governance / scope |
|---|---|---|---|
| Port Authority of New York & New Jersey | $4.8 B | 2022 | Bi-state authority; includes airports, bridges, tunnels, PATH transit |
| Port of Los Angeles | $799 M | 2025 | City Harbor Department; cargo-focused; #1 US container port |
| Georgia Ports Authority | $699 M | recent | State authority; cargo-only; #3 US container port |
| Port of Houston | $520 M | 2021 | Independent navigation district; cargo-focused |
| Port of Long Beach | $412 M | 2021 | City Harbor Department; cargo-focused; #2 US container port |
| Port of Oakland | $409 M | 2023 | Independent city department; includes Oakland airport |
| Port of Seattle | ~$300 M | recent | Public Port District; includes SEA airport; can levy property tax |
| Port of San Francisco | $128 M | 2024 | Self-supporting enterprise department; ~80% non-maritime revenue |
Ports that operate co-located airports — Oakland, Seattle, PANY/NJ — carry materially higher revenue than maritime-only peers, so the cleanest like-to-like comparisons for San Francisco are Long Beach (cargo-focused, no airport) and Oakland (maritime portion only). The MuniIntel analysis of port credit quality identifies San Francisco, Long Beach, Los Angeles, and Seattle as the major US ports with the highest credit ratings (AA or better). Of that AA-rated peer group, the San Francisco Port carries the highest non-maritime revenue diversification. San Francisco is a small port that has been rated as well-managed in part because of its non-maritime revenue diversification, which is the same diversification this essay is documenting.
The Port of Oakland operates an airport-anchored enterprise. FY 2024 operating revenue divides approximately 50% aviation, 39% maritime, 7% utilities, 4% commercial real estate. The Port of San Francisco operates a real-estate-anchored enterprise, 79% non-maritime (real estate, hospitality, development ground leases, other) and 18% maritime. Same legal apparatus, different asset mix inside the enterprise. Oakland holds Oakland International Airport. San Francisco does not.

The Port of San Francisco is the institution that maintains 7.5 miles of working waterfront, operates the city’s only deep-water cargo terminal at Pier 80 (currently leased to Pasha Stevedoring under a long-term agreement for automobile import/export and project-cargo operations, with break-bulk capacity preserved), manages the cruise terminal, runs the historic Fisherman’s Wharf commercial fishing harbor, and holds the public trust mandate over tidelands granted in 1968. Less than one-fifth of its operating revenue currently comes from those activities. The majority comes from real estate leasing, hospitality and retail rents, and parking.
This is not a recent shift. The pattern has been visible since the late 1990s and is the dominant trend across the FY 2011 to FY 2024 reporting window shown in Figure 3. Maritime revenue holds essentially flat in nominal dollars across the thirteen-year period. In inflation-adjusted terms, it declined. Real estate revenue and parking carry all of the observed growth. The underlying maritime contraction extends further back. The late-1960s containerization shift to Oakland (covered in Part 2) compressed Port of San Francisco maritime tonnage by more than half between 1965 and 1985, and the revenue mix has been rebalancing toward non-maritime sources since.
What sits inside the real estate line
The non-maritime revenue category breaks into three sub-categories.
Commercial and industrial leases (rental income from tenants in Port buildings, piers, and inland seawall lots used for warehousing, light manufacturing, distribution, office, and similar uses) have been roughly flat in real terms across the reporting window. The Port has not been growing its conventional commercial-and-industrial leasing book.
Hospitality, retail, and restaurant leases, concentrated on the Northern Waterfront (Fisherman's Wharf, the Cruise Terminal, the Ferry Building corridor) and at Pier 70 ground-floor amenity space, have grown modestly in nominal terms, tracking visitor recovery from the 2020-2022 pandemic low.
A note on cruiseThe James R. Herman Cruise Terminal at Pier 27 is the Port’s signature passenger-maritime asset and features prominently in Port communications. Cruise revenue is split across two reporting lines. Ship-related fees (wharfage, dockage, passenger fees) sit inside the 18% maritime line. Ground-floor tenancy at the Cruise Terminal building sits inside the hospitality / retail line of the non-maritime category. The cruise terminal is prominent and revenue-modest relative to the total operating revenue base.
Development ground leases are the actual growth engine. These are long-term ground leases from Mission Rock, Pier 70 Waterfront, and Historic Pier 70 (all in the Central Waterfront), under which the Port leases land to private development entities who in turn build and operate residential and office buildings on Port-controlled land released from public trust restrictions through site-specific California legislation. The category did not exist meaningfully in FY 2011. It is now the fastest-growing revenue line at the Port. The growth is concentrated on the Northern and Central Waterfront. The Southern Waterfront contributes a small share of the real-estate revenue line, because the Southern Waterfront's tenancy is largely industrial market-rate leases, not the hospitality and ground-floor retail driving the growth.
Why the mix shifted
The Embarcadero Freeway demolition in 1991 (covered in Part 2) opened the Northern Waterfront physically. Site-specific California legislation released Pier 70 SUD and Mission Rock from public trust restrictions for residential and office uses. The September 2019 Master Indenture amendment, walked through in detail in Section 3, moved both parcels out of the Industrial Portfolio reporting line. Three moves, each a deliberate act by City, state, or Port.
The Industrial Portfolio's Reported Shrinkage
Two numbers from the Port's industrial-portfolio reporting describe what happened (Figure 4).

Industrial-portfolio acreage declined by 43% between FY 2015 and FY 2022, from approximately 9.8 million square feet to approximately 5.6 million.
Industrial-portfolio revenue per square foot increased by 134% over the same period.
A 43% decline in industrial-zoned acreage at the institution holding the public trust mandate for working waterfront land is not a small number, and neither is a 134% rise in revenue per square foot in a portfolio where industrial rent inflation has come nowhere close to that pace anywhere in the Bay Area. The two figures are arithmetically linked. If the denominator drops 43% and the numerator holds roughly steady, the per-square-foot calculation rises mechanically. The question is what the 43% actually reflects. The decline is partly real and partly categorization, in shares the next two subsections walk through.
The real component
The clearest real loss is BAE Systems, the defense contractor that operated the Pier 70 shipyard for ship repair and naval refit work for decades. BAE Systems vacated Pier 70 in FY 2018, releasing approximately 509,000 square feet of industrial-tenanted space. Other smaller-scale industrial tenancy losses occurred across the reporting window, mostly individual lease non-renewals. In aggregate, real losses account for roughly 1 to 1.5 million of the 4.2 million square foot decline.
What changed in 2019
The larger portion is accounting reclassification. In September 2019, the Port executed documents under Section 2.14 of its Master Indenture that made effective the Port Commission’s earlier designation of the Pier 70 SUD and the Mission Rock Project Site as “Special Facilities.” The revenues from those two project sites became Special Facility Revenues, no longer included in the Net Revenues pledged to the Port’s Revenue Bonds, and the underlying acreage moved out of the Industrial Portfolio line into a separately reported Development Ground Lease category. Approximately 2.5 to 3 million square feet of acreage that had been entitled for residential and office use under site-specific California legislation was affected by this reclassification. The reclassification appears in the Port’s Master Indenture documents and in the footnote disclosures of the FY 2020 and subsequent financial statements. It is not flagged as a category-defining transition in the Port’s public communications about its industrial portfolio. The 43% acreage decline figure has been cited in subsequent Port communications without consistent reference to the reclassification mechanism that accounts for the majority of it.
A recent example sits one parcel south of Pier 70. The Sophie Maxwell Building, an 8-story 105-unit affordable housing complex at 1212 Maryland Street, opened October 2025 within the 29-acre Potrero Power Station redevelopment (a separate Special Use District approved by the Board of Supervisors in April 2020, adjacent to but legally distinct from Pier 70 SUD). The site is the former PG&E generating station. 2.9 acres of the broader 29-acre footprint are Port of San Francisco property folded into the master entitlement. Mayor Lurie attended the ribbon cutting.
What the 134% figure actually means
The 134% revenue-per-square-foot increase is arithmetically real, but largely compositional. When the 2019 amendment moved Pier 70 SUD and Mission Rock out of the Industrial Portfolio line, the parcels that remained were disproportionately the lower-rent industrial holdings on the Southern Waterfront: warehousing, construction-equipment staging at Piers 94 and 96, the Pier 80 break-bulk and cargo terminal. A category that loses its lowest-revenue acreage (BAE vacated) and reclassifies its highest-revenue former-industrial acreage (Pier 70 and Mission Rock entitled) into a separate line produces a tighter, higher-rent remaining portfolio. The Port’s numbers are accurate. They do not mean what a casual reading suggests.
Industrial-zoned land in cross-city context
San Francisco’s industrial-zoned land base has compressed within its own boundaries over the past three decades. Where it sits relative to peer cities depends on which peer. Jurisdictions with deeper industrial-history depth (Los Angeles, Detroit) maintain proportionally larger industrial-zoning bases than San Francisco. Jurisdictions with thinner industrial-history depth (Austin, Boston) sit lower or comparable. The city physically adjacent to San Francisco in the same metropolitan economy (Santa Clara) dedicates several times the proportional share of its land to industrial use. The global hardtech benchmark (Shenzhen) sits at roughly four times San Francisco’s share, under an active policy of protecting industrial land from conversion. The comparison below uses industrial-zoned acreage as a share of total city land area, which is the only consistent like-to-like metric across jurisdictions with different zoning regimes (Table 2). For Detroit and Austin, the figures are order-of-magnitude estimates from secondary sources rather than direct from-source counts. For the other jurisdictions, the figures are sourced directly.
| Jurisdiction | Industrial-zoned (acres) | City land area (acres) | % of city | Source · confidence |
|---|---|---|---|---|
| San Francisco | 2,780 | 30,000 | 13% | SF Planning Department, 1990s baseline · high |
| San Francisco | 1,500 | 30,000 | 7% | SF Planning Department, post-Eastern Neighborhoods rezoning (2008) · high |
| Santa Clara, CA | 2,290 | 12,160 | 19% | City of Santa Clara, Economic Growth Data · high |
| Los Angeles | 19,000 | 302,000 | 8% | LA Department of City Planning, Industrial Land Use Study, December 2007 (excludes Port of LA and LAX) · high |
| Boston | 1,500 | 31,000 | 4% | Boston Planning & Development Agency, citywide land use analysis · high |
| Detroit | 12,000-14,000 | 86,000 | 14-16% | Estimate from Detroit City Plan Commission 1940s baseline and SEMCOG land use review documentation · order-of-magnitude |
| Austin | 6,000-10,000 | 205,000 | 3-5% | Estimate from City of Austin Land Use Inventory and industrial-zoned concentration in East Austin / North Burnet·Gateway corridors · order-of-magnitude |
| Shenzhen, China | 136,000 | 493,500 | 28% | Peer-reviewed GIS study (Tandfonline 2024); Shenzhen Municipal Planning Bureau Detailed Planning Map · high. Down from a higher historical share through urban-renewal conversion; PRC introduced an M0 industrial land-use category specifically to protect industrial space from further conversion |
What Table 2 shows, relevant to the Port of San Francisco question: San Francisco’s industrial-zoned share contracted from approximately 13% to 7% of city land between the 1990s baseline and the December 2008 Eastern Neighborhoods rezoning, roughly a 45% reduction in proportional terms within one jurisdiction over roughly fifteen years. The city physically adjacent to San Francisco within the same metropolitan economy, Santa Clara, dedicates approximately 19% of its city land to industrial use, almost three times the post-2008 San Francisco share. The Bay Area’s hardtech industrial-policy footprint is concentrated in Santa Clara and surrounding Silicon Valley cities, not in San Francisco. And Shenzhen, the city most often referenced as the global hardtech benchmark, sits at approximately 28% industrial-zoned share, about four times the post-2008 San Francisco figure, and operates under an active municipal policy of protecting industrial land from conversion through a newly introduced M0 industrial land-use category. A meaningful share of San Francisco’s remaining post-2008 industrial-zoned land sits on Port-controlled tidelands. That land is governed by the public-trust apparatus documented in Section 1, which is why this piece focuses on the Port. Part 2 includes a privately-operated PDR comparator one mile inland from Pier 70 (the American Industrial Center) and the geographic concentration of the remaining Port-controlled industrial acreage in District 10.
The Capital Backlog
The Port’s documented 10-year capital need averages roughly 5x its annual operating revenue, and the actually-funded operational plan addresses approximately 16% of identified state-of-good-repair need. This is the financial pressure behind every revenue-strategy discussion across both parts of this essay. On April 22, 2025, the Port Commission adopted Resolution 25-20, the FY 2026-FY 2035 10-Year Capital Plan (Figure 5, Table 3).

| Item | Amount |
|---|---|
| Total 10-year capital need | $6.1 billion |
| Projected funding (all sources) | $3.5 billion |
| Unfunded need | $2.6 billion |
| Of which unfunded state-of-good-repair (SOGR) | $1.9 billion |
| Of which unfunded enhancement | $680.9 million |
| Five-Year Capital Improvement Program (CIP) | $404.3 million |
The headline number is the $6.1 billion 10-year need, up from $4.1 billion in the prior plan. The $2 billion increase reflects three things: continued aging of existing infrastructure, expanded scope on seawall and resilience work, and a methodology shift from project-based to authority-based budgeting that captures previously uncounted maintenance obligations.
The number worth pausing on is the Five-Year CIP at $404.3 million against $1.9 billion in unfunded SOGR. The CIP is the operational plan, the actual schedule of capital projects the Port intends to execute in the near term. It addresses approximately 16% of the documented SOGR backlog. The remaining 84% is unfunded over the planning horizon, meaning the Port has documented it, agrees it is necessary, and has no funded path to do it.
The Plan also identifies three external capital flows that are not core Port revenue. The Waterfront Resilience Program could draw up to $13.5B in potential leveraged investment, largely contingent on federal share from the U.S. Army Corps of Engineers' San Francisco Waterfront Coastal Flood Study, currently in design phase and not yet authorized or appropriated. Proposition A, the November 2018 Embarcadero Seawall Earthquake Safety Bond, authorized $425M in general obligation bonds, drawn incrementally as projects reach construction. ARPA funds carry a November 2026 obligation deadline, making the ARPA contribution one-time rather than recurring.
Port communications have at times positioned development ground lease growth as the capital strategy that funds the seawall and infrastructure backlog. The documentary record shows this is partial. The Army Corps federal share (up to $13.5B) and the Prop A general obligation bond ($425M) together represent the larger external capital path the Port has identified, and neither industrial rents nor development ground leases at currently documented scale close the $2.6 billion unfunded gap on their own. Peer ports of similar size and credit rating — Long Beach, Los Angeles, Seattle — carry comparable capital pressures and have not pivoted their revenue mix to the same degree.
Clarifying note · Waterfront Resilience ProgramThe $13.5B figure refers to the San Francisco Waterfront Coastal Flood Study, a joint Port and U.S. Army Corps of Engineers project to design coastal flood defenses (seawall raise, pier rebuild, shoreline protection) along the 7.5 miles of Port-controlled waterfront. The federal share would be approximately 65% of total cost, contingent on Congressional authorization through the Water Resources Development Act of 2026 and subsequent annual appropriations. The program is separate from the federal cleanup of the Hunters Point Naval Shipyard Superfund site, which is the responsibility of the U.S. Navy with EPA oversight and is covered in Part 2.
Geographic distribution
The Five-Year CIP allocates $404.3 million across the Port’s geographic zones, with the largest share directed at the Embarcadero seawall (Northern and Central Waterfront), followed by Pier 70 and Mission Rock site infrastructure (Central Waterfront, supporting the development ground lease projects in Section 2), and a smaller share to Southern Waterfront industrial-zoned acreage at Piers 80, 90-94, and 96. The Southern Waterfront receives the smallest share despite containing roughly 80% of the Port’s industrial-zoned acreage. The Port spends its capital where it earns its money. The Northern and Central Waterfront, where most of the revenue comes from, receive most of the planned investment. The Southern Waterfront, where most of the industrial-zoned acreage sits, receives the smallest share.
How the Plan was approved
Resolution 25-20 was on the Consent calendar at the April 22, 2025 Commission meeting. It passed unanimously, in a single bundled roll-call motion, with no Commissioner questions on the $6.1 billion total need, the $2.6 billion unfunded gap, the methodology shift, or any specific line item. The 10-Year Capital Plan governs the Port’s capital posture through FY 2035.
Continue to Part 2 → The Port Commission Record Where Part 1 maps the portfolio, the revenue mix, and the capital backlog, Part 2 documents the institutional record. It covers the statutory cage, the geographic concentration in Bayview-Hunters Point, the 35-year thread on Proposition H, the Commission’s operating pattern, and the Summer 2026 decision window. →